The GPU Status View
On this page:
Along with using GPUs and other hardware accelerator processing units designed for HPC computing, programmers may also incorporate hybrid parallelism combining multiple MPI processes with other multi-threaded and device-aware programming models intended to effectively harness on-node parallelism, such as OpenMP.
Given the scales and number of layers involved, global GPU analysis features are required to be able to determine the execution state of one or more GPUs in a job. For example, a process running code on a single GPU may contain tens of thousands of executing lanes (i.e., threads). The individual lanes are grouped into warps of 32 lanes while hundreds of warps are grouped into blocks. Thousands of blocks are then spread across dozens of streaming multiprocessors.
Compounding the complexity found on a single GPU, a single process may be running code on multiple GPUs, and that process may be part of an MPI job consisting of tens, hundreds, or even thousands of processes, each running code on their own GPUs. Even a modest-sized MPI job may consist of millions of blocks and tens of millions of lanes.
The GPU Status view provides the ability to filter, sort, and aggregate GPU execution status and to control the focus to support setting group, process, and device (CUDA context thread) widths.
Using this view, you can:
-
Aggregate and filter the GPU status information from one or more GPU devices and from one or more processes, based on a number of user-selected state variables.
By default, the selected state variables used in the aggregation include the process ID, the device, the CUDA thread execution state (i.e., stopped, breakpoint, etc.), the function, and the GPU physical device information (SM, warp, lane).
-
Sort the output by any of the state variables used in the aggregated tree output.
-
Change the focus width of the view to show the status for either a group (control or share group), a single process (the current process in focus in the UI), or a single TotalView CUDA context thread.
The GPU Status view is a visual representation in the UI of the CLI command dgpu_status.
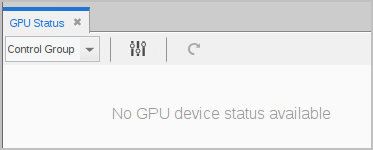
To turn on the view, load a GPU program, then select Windows > Views > GPU Status. The view is empty until the program starts running.
The view also opens automatically when TotalView recognizes a kernel loaded on the device and a CUDA context thread is created.
The GPU Status View Focus Options
Figure 137 shows the view after a program has loaded a GPU kernel and stopped at a breakpoint. By default, the view displays the process ID, physical GPU coordinates, function name, and execution state.
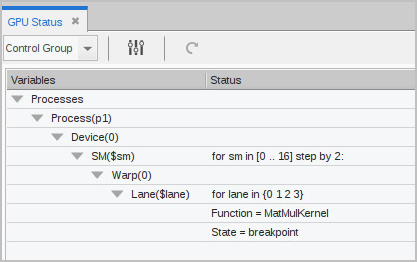
This GPU program is running:
-
A single process (p1)
-
On one device (0)
-
With 9 SMs, identified using a stride of “2” (which truncates the list for UI display). In this case, the SM identifiers would be 0, 2, 4, 6, 8, 10, 12, 14, and 16.
-
With each SM containing one warp (0)
-
With each warp containing 4 lanes (0, 1, 2, 3)
-
With all lanes stopped at breakpoint in function
MatMulKernel().
The view has a Focus width dropdown which includes the Control Group, Share Group, Process, and a list of any CUDA context threads within the focus process.
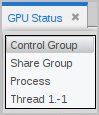
The focus width is based on the process that is currently in focus in the UI. A focus of "Share Group," for example, it would be the share group containing the process in focus in the UI.
Other features of this view:
-
The configure button (
 ) launches the Configuration Options dialog for grouping, sorting, and filtering data in the view.
 -
The update button (
 ) updates the view. The view is not automatically updated when status changes. When grayed out, the view is up to date.
Configuring the GPU Status View
You can group and sort the aggregated data based on a range of state variables, using the Configuration Options dialog, opened by selecting the configure button (![]() ).
).
Figure 138. GPU Status Configuration Options dialog
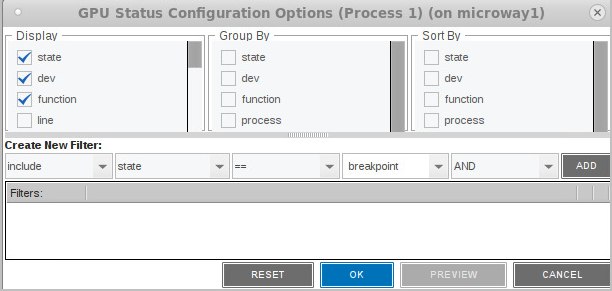
Select Variables to Display
Variables selected in the Display column are placed into the Group By and Sort By columns where they are available to be selected to change the aggregation. Some variables are selected for display by default, including state, dev, function, process, sm, warp, and lane. Add or remove variables by checking them in the Display column. Table 19 lists all available state variables.
Selecting or deselecting any item in this dialog activates the Preview button. For example, select line to add it to the display, then press Preview.
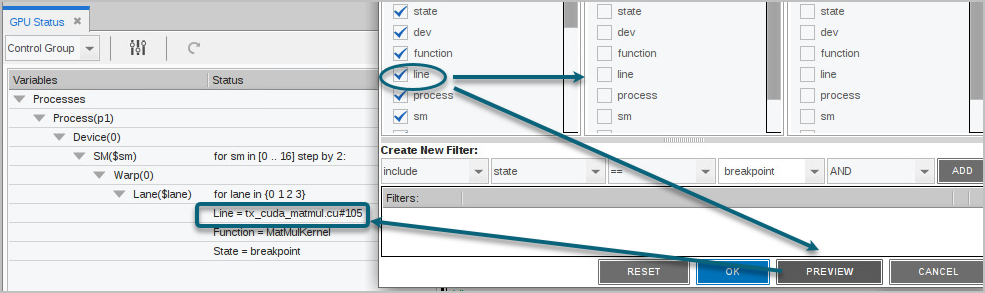
The line number is added to the display.
Preview provides just a temporary display of the view. Click OK to save the view or Reset to return the view to its default settings. Cancel closes the view with no changes.
Select Variables to Group or Sort By
Select one or more variables in the Group By or Sort By columns to change the grouping and sorting display.
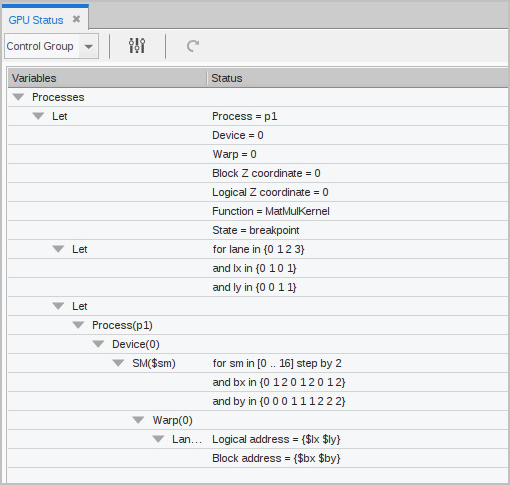
Display by logical coordinates
For example, check the logical coordinates (bx, by, bz, lx, ly, lz) under Display, then select them in the Group By menu to change the display to logical coordinates, and then group by those coordinates.
Figure 139. Configuration “Group By”
Group by state
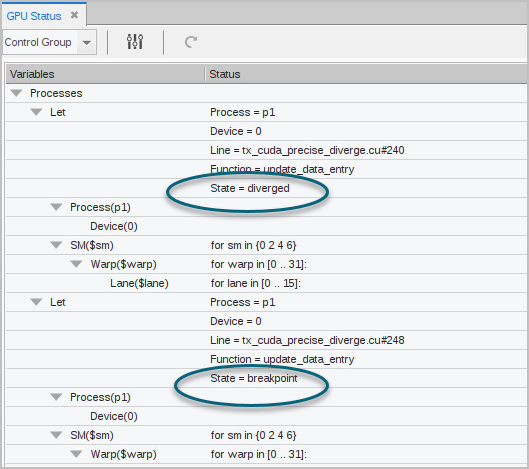
Consider a program in which the threads unexpectedly diverge, as displayed in the view:
Figure 140. Diverging threads in the GPU Status view
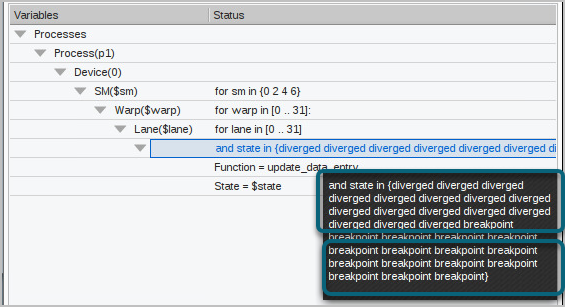
-
The four active SMs, numbered 0, 2, 4, and 6, have a state of either breakpoint or diverged.
-
In each SM, 32 warps, numbered 0 through 31, are valid.
-
In each warp, 32 lanes are valid. However, some of the lanes have diverged, visible in the tooltip that displays over long lines. The rest are at breakpoints.
To make the view more useful, add line to the display and then group by lane state.
Figure 141. Grouping by thread state
While the information has not changed, it’s now easy to see that, in every warp and SM, half the lanes — numbers 16 through 31 — have hit the breakpoint on line 248. The other half of the lanes — numbers 0 through 15 — have diverged and are all at line 240.
You can use an include custom filter to refine the view further. See Configuring Custom Filters.
State Variables for Grouping and Sorting
|
State Variable |
Description |
|
state |
State of a lane. An enumerated value |
|
dev |
Device ID for GPU (an integer) |
|
function |
Name of the function that contains a lane PC |
|
line |
"filename#number": the file and line number of a lane PC |
|
process |
CPU process ID, either as MPI rank or as dpid |
|
sm |
ID of an SM (an integer) |
|
warp |
ID of a warp within an SM (an integer) |
|
pc |
PC of a lane (an integer) |
|
lane |
ID of a lane within a warp (an integer) |
|
dev_type |
GPU device type (a character string) |
|
sm_type |
SM type for the GPU (a character string) |
|
sm_count |
Number of SMs in the device (an integer) |
|
warps_per_sm |
Number of warps in each SM (an integer) |
|
lanes_per_warp |
Number of lanes in each warp (an integer) |
|
regs_per_lane |
Number of registers available to each lane (an integer) |
|
valid_warp_mask |
Bit mask indicating which warps are valid in an SM |
|
valid_lane_mask |
Bit mask indicating which lanes are valid in a warp |
|
active_lane_mask |
Bit mask indicating which lanes are active in a warp |
|
broke_lane_mask |
Bit mask indicating which lanes are at breakpoints |
|
bx |
X coordinate of a block (an integer) |
|
by |
Y coordinate of a block (an integer) |
|
bz |
Z coordinate of a block (an integer) |
|
lx |
X coordinate of a thread within a block (an integer) |
|
ly |
Y coordinate of a thread within a block (an integer) |
|
lz |
Z coordinate of a thread within a block (an integer) |
Configuring Custom Filters
Create a custom filter in the Create New Filter pane in which you can include or exclude values that match or do not match the values of certain state variables from the display. This pane contains combo boxes for building the filter.

-
Include/exclude: Determine whether to “include” or “exclude” a filter. If both “include” and “exclude” filters are specified, the first one determines the overall behavior.
For example, if “include” comes first, then only threads meeting the criteria will be included. If '“exclude” is first, then all threads that don't meet the criteria will be displayed. Subsequent “include” and “exclude” filters define exceptions to this overall behavior. See Figure 143 for an example.
-
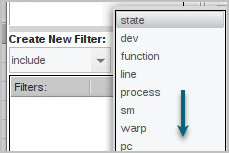
Variable: Choose a variable from the dropdown. The variable state is the default.
-
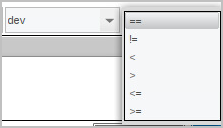
Comparison operator: Depends on the selected variable. If the state variable is a string value, the dropdown shows only == and !=. However, if it is an integer value, the dropdown contains additional comparison operators, like so:
-
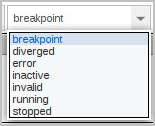
Value to compare: Enter the value to compare against here. The value field is an editable text box. For variables that have a limited set of valid values, those values are displayed. For instance, choosing the variable state populates this dropdown with a list of possible states:
-
AND/OR: Within a list of “include” or “exclude” filters, the predicates can be either “ANDed” or “ORed” together. If there are both AND and OR predicates, AND takes precedence over OR.
To build a filter, select the elements, then click ADD.
Examples
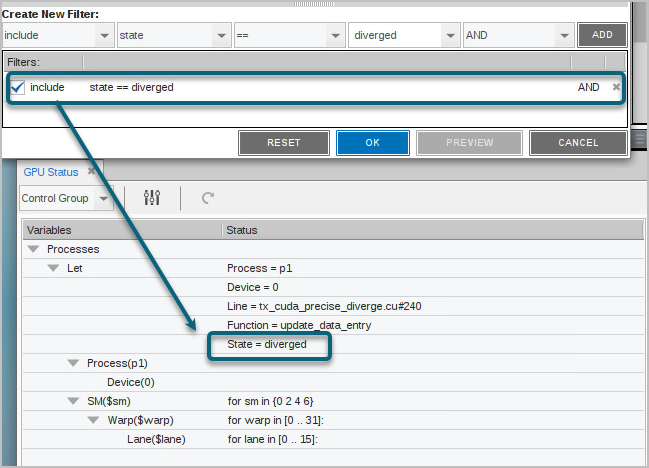
Let’s look again at the program in which the threads diverged (Figure 140). In addition to grouping the output by thread state, Figure 142 uses a custom filter to limit the display to show only those threads that have diverged.
Figure 142. Custom filter by a state of “diverged”
You can create multiple custom filters, and activate or de-activate them using the left checkbox.
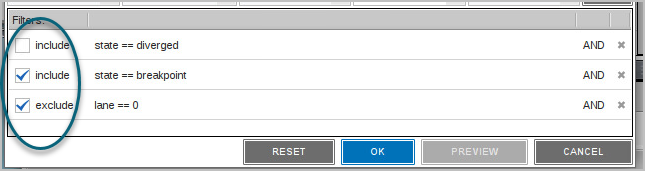
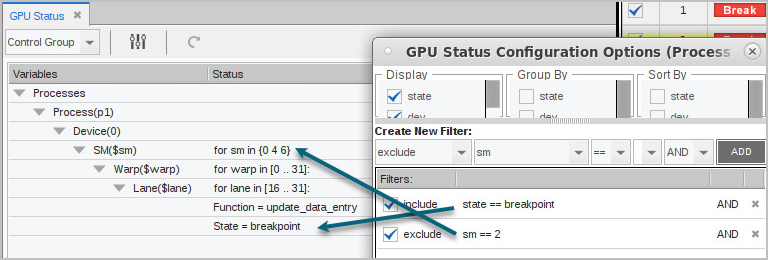
Use “include” and “exclude” together to establish the overall filter behavior, then refine it. Figure 143 first includes all threads at breakpoint, but then excludes those running on SM 2.
Figure 143. Mixing include and exclude filters