Memory Debugging Options
Several memory debugging options are available to refine your debugging session. Set these either in the Session Editor before starting your debugging session or from within a debugging session using the menu item Debug > Memory Options or by selecting the icon “Enable memory debugging” from the memory toolbar.
Available options are:
In the Session Editor, choose the settings icon to configure individual options:
Figure 191, Memory Options Available from the Session Editor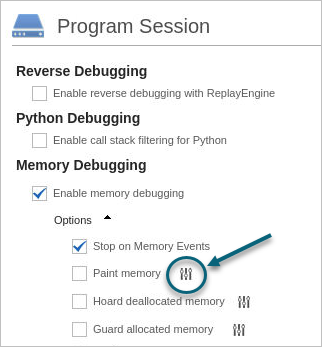
From within a debugging session, first choose Debug > Enable Memory Debugging, then Memory Options to open the Memory Options dialog:
Figure 192, Memory Options Available from the Debug Menu and the Memory Toolbar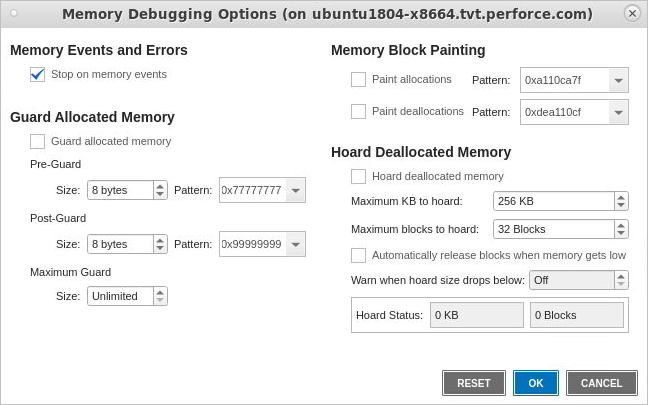
CLI Commands
In the CLI, the dheap command controls memory debugging behavior, including memory options. For more detail, see dheap in the TotalView Reference Guide.


