Creating Barrier Points, Evalpoints, and Watchpoints
Definitions
A breakpoint stops execution of processes and threads that reach it. See Breakpoints.
An evalpoint executes a code fragment when it is reached. See Evalpoints.
A watchpoint monitors a location in memory and stops execution when a provided condition is met. See Watchpoints.
A barrier point synchronizes a set of threads or processes at a location. See Barrier Points.
Identifying Icons for All Types of Action Points
In the Action Points view, evalpoints, barrier points and watchpoints created in the CLI display as ![]() ,
, ![]() , and
, and ![]() icons.
icons.
In the Source view, evalpoints and barrier points show up as line numbers with the same colors, for example,  identifies an evalpoint. Watchpoints do not appear in the Source view because they represent memory locations, not lines in the code.
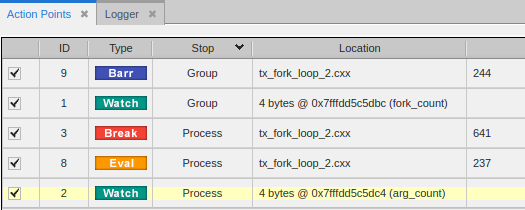
In the Action Points view, these action points look like this:
On this page:
Breakpoints
The CLI provides additional parameters for breakpoints, some of which are not yet supported in the UI. For example, you can provide a specific function or address on which to set a breakpoint:
dbreak breakpoint-expr
dbreak -address addr
Set a breakpoint directly on a function:
dbreak my_function
Sets a breakpoint on the function my_function. If multiple files include this function, this call sets a breakpoint in all the files.
Note: For breakpoints on functions of the same name that span multiple files, the UI currently displays each breakpoint with the same ID. Deleting one deletes all breakpoints that match that ID.
Set a breakpoint directly on an address:
dbreak -address 0x2b0b7aad1470
Sets a breakpoint at a specific address, useful to observe a specific location in memory.
Evalpoints
A breakpoint with associated code is an evalpoint. When your program reaches an evalpoint, TotalView executes the code. Evalpoints can contain print statements, commonly used in debugging, but, unlike print statements, don’t require that you recompile your program. They also let you patch your programs and route around code that you want replaced—for example, to branch around code that you don’t want your program to execute or to add new statements.
dbreak line-number -e expr
For example:
Print the value of result:
dbreak 597 -e { printf("The value of result is %d\n", result) };
Note that this breakpoint does not stop execution. Evalpoints do exactly what you tell them to do; you don’t have to stop program execution just to observe print statement output.
Skip some code:
dbreak 50 -e {goto 63};
Any thread that reaches this breakpoint transfers to line 63.
Stop a loop after a certain number of iterations:
dbreak 597 -e { if ( (i % 100) == 0)
{
printf("The value of i is %d\n", i);
$stop;
}
;
Uses programming language statements and a built-in debugger function to stop a loop every 100 iterations. It also prints the value of i.
dbreak 597 -e { $count 100 };
In contrast, this evalpoint just stops the program every 100 times a statement is executed.
Watchpoints
To create a watchpoint expression with the CLI, use the -e argument on the dwatch command, and enter an expression. The expression is compiled into interpreted code that is executed each time the watchpoint triggers.
dwatch -e expr
TotalView has two variables used exclusively with watchpoint expressions:
$oldval: The value of the memory locations before a change is made.
$newval: The value of the memory locations after a change is made.
For example:
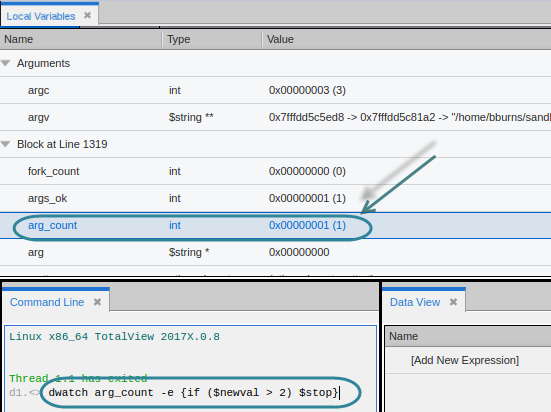
{if ($newval > 2) $stop}
This watchpoint triggers when the updated value of the variable arg_count equals more than two.
At this point, you can see in the Local Variables view that arg_count equals 1:
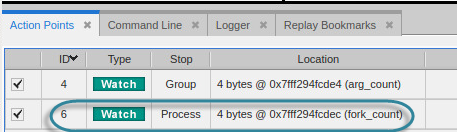
The watchpoint is now reflected in the Action Points view with the watchpoint ![]() icon:
icon:
When you advance the program by choosing Go, Next or Step, for instance, TotalView stops at this watchpoint when the value of arg_count has been incremented past 2.
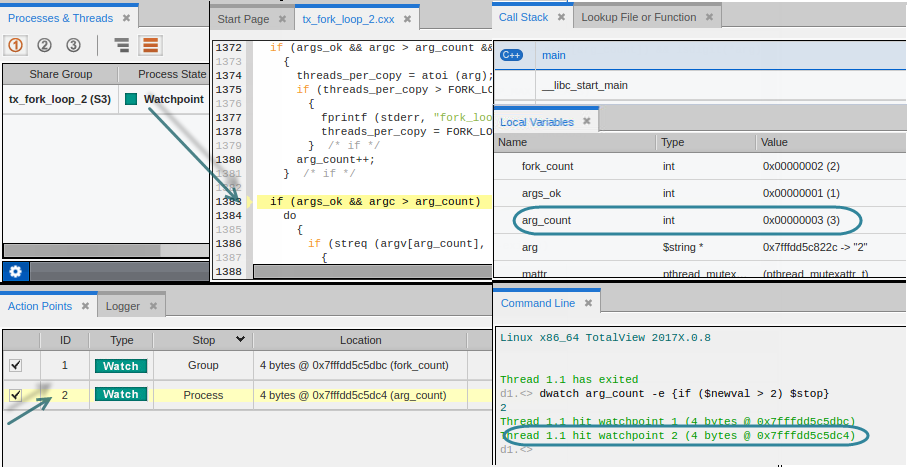
The Processes & Threads view reports the Process State stopped at this watchpoint.
The Source view identifies the location of the PC.
The Local Variables view reports that arg_count’s value is at 3.
The Command Line view reports that watchpoint 2 has been hit.
The Action Point view displays a pale yellow background to identify the stopped watchpoint.
|
Breakpoints |
|
|
Evalpoints |
|
|
Barrier points |
|
|
Watchpoints |
Barrier Points
In a multithreaded, multi-process program, threads and processes are often executing different instructions, so cannot be easily synchronized to all stop at the same breakpoint. Use a barrier breakpoint to hold processes and threads that reach the barrier point until all have reached it. With a barrier point, you can use the Group > Go command as many times as it takes to get all of your processes to the barrier, and you won’t have to worry about a process running past it.
The Processes and Threads pane displays which processes have hit the barrier, grouping all held processes under Breakpoint in the first column.
dbarrier line-number
You can fine-tune how a barrier works to define additional elements to stop when a barrier point is satisfied or a thread encounters a barrier point. You can also incorporate an expression into a barrier point, similar to an evalpoint.
To insert a default barrier point:
dbarrier 123
This barrier stops each thread in all processes in the control group when it arrives at line 123. After all processes arrive, the barrier is satisfied, and TotalView releases all processes.