Browsing for Variables
The Process Window Tools > Program Browser command displays a window that contains all your executable’s components. By clicking on a library or program name, you can access all of the variables contained in it.
 |
The window at the top of the figure shows programs and libraries that are loaded. If you have loaded more than one program with the File > Debug New Program command, TotalView displays information only for the currently selected process. After diving on an entry in this window (labeled Dive 1), TotalView displays a Variable Window that contains a list of files that make up the program, as well as other related information.
Diving on an entry in this Variable Window (Dive 2 in this figure) changes the display to contain variables and other information related to the file. A list of functions defined within the program is at the end of this list.
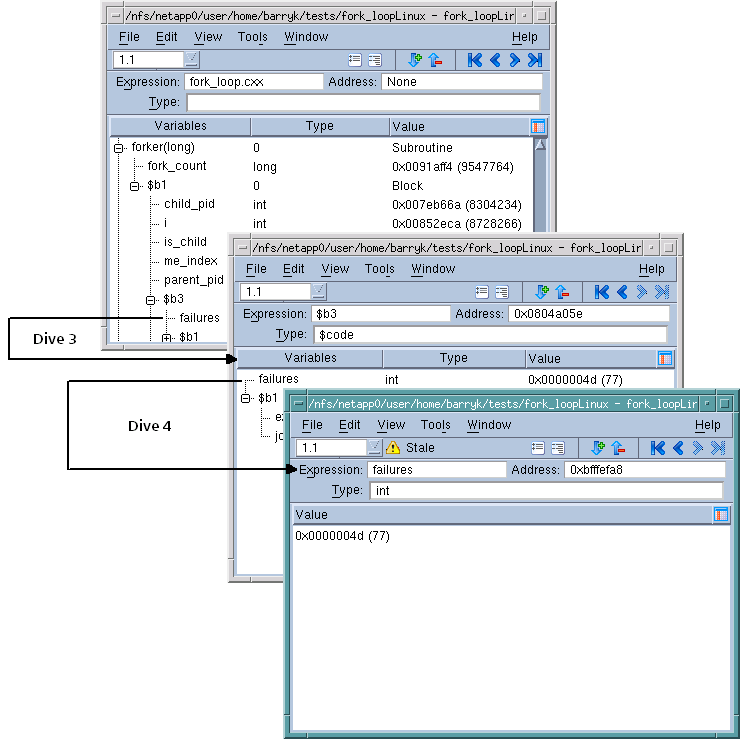
Diving on a function changes the Variable Window again. The window shown at the top of the next figure was created by diving on one of these functions. The window shown in the center is the result of diving on a block in that subroutine. The bottom window shows a variable.
 |
If you dive on a line in a Variable Window, the new contents replace the old contents, and you can use the undive/redive  buttons to move back and forth.
 buttons to move back and forth.
If you are examining a complex program with large numbers of subroutines at file scope, often a result of a large number of include files and/or template class expansions, you may experience a performance slowdown. By default, the windows in this view display as much information as possible, including all symbols for all subroutines in a file scope. You can restrict views to initially show only the names of subroutines within a file scope by adding this to your .tvdrc file:
dset TV::recurse_subroutines false
You can then still examine the symbols within a particular subroutine by diving on that subroutine.
Diving in variable windows | |
Details on the Variable Window | The "Variable Window" in the in-product Help |


