Options Dialog Box
Commands and controls on the Layout Tab control how TotalView displays information.
 |
Layout area
TotalView can arrange nodes in a grid (rows and columns) or in a circle. In addition, if you’ve saved a layout using a button in the Save As tab, you can restore that layout and use it.
Grid Constraints area
When displaying nodes in a grid, you can constrain the number of rows or columns to the value indicated in the text box. The Layout Tab figure shows consume being selected.
Circle Constraints area
When displaying nodes in a circular pattern, you can constrain the size of the circle.
Other
Keep Nodes As Positioned
When selected, TotalView will not rearrange nodes that you have moved.
Scale To Drawing Area
When selected, TotalView arranges the information so that it fits within the displayed window
You can manually rearrange the placement of ranks and lines as follows:
Cycle Detection Tab
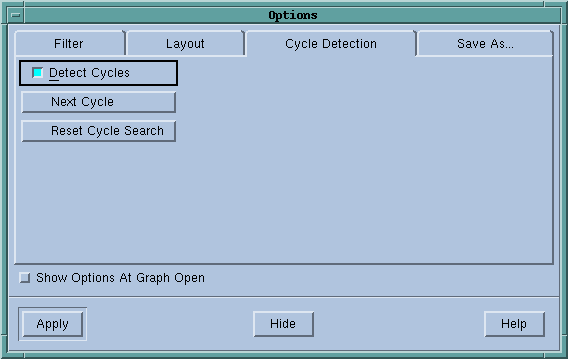
Commands and controls on the Cycle Detection tab control how TotalView displays cycles within the message queue graph.
 |
Detect Cycles
When selected, TotalView looks for cycles after it redisplays a message queue graph.
Next Cycle
If your display as more than one cycle, pressing this button moves you from one cycle to another.
Reset Cycle Search
If you’ve cycled through all of the cycles, you can reset the search using this button.
Filter Tab
Commands and controls on the Filter Tab determine which nodes TotalView displays.
 |
The colored buttons have the following meanings:
Other controls in the tab let you:
Save As Tab
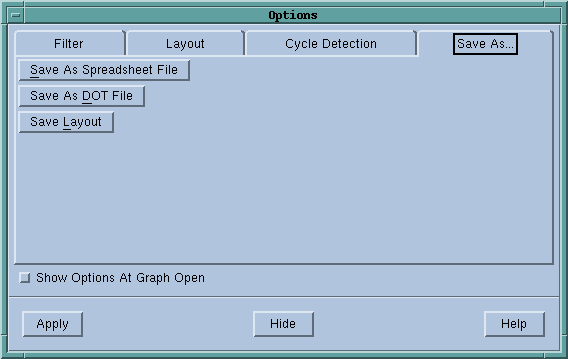
Commands on the Save As Tab tell TotalView to save message queue information.
 |
Save as Spreadsheet File
Pressing this button tells TotalView to save message queue graph information as a CSV file. This file can later be imported into a spreadsheet.
Save As DOT File
Pressing this button saves the graphic information as a DOT file. Third party graphic systems such as Graphviz
Save Layout
Pressing this button tells TotalView to save the layout in a proprietary format. You can restore this layout using the Get Saved Layout button on the Layout tab.
Layout Tab


