Debugging a Core File
If a process encounters a serious error and dumps a core file, you can load the file to examine it.
To debug a core file, select either
The “Core or Replay Recording File Session” dialog launches. Enter a name for the session and the program and core file’s name.
NOTE: Any previously entered sessions of the same type are available from the Session Name dropdown box. Once selected, you can change any session properties and start your debug session. See Editing or Starting New Sessions in a Sessions Window.
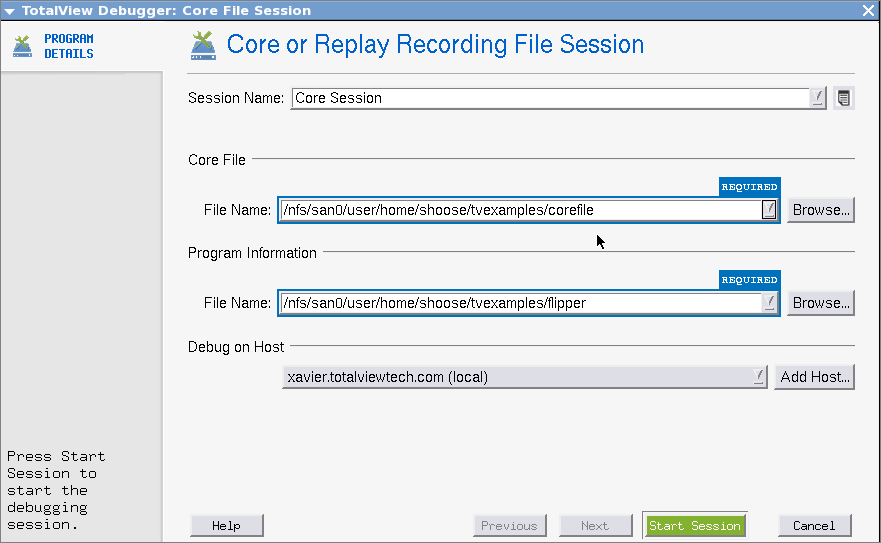 |
If the program and core file reside on another system, enter that system’s name in the Debug on Host area (see Adding a Remote Host for details).
If your operating system can create multi-threaded core files (and most can), TotalView can examine the thread in which the problem occurred. It can also show you information about other threads in your program.
When TotalView launches, the Process Window displays the core file, with the Stack Trace, Stack Frame, and Source Panes showing the state of the process when it dumped core. The title bar of the Process Window names the signal that caused the core dump. The right arrow in the line number area of the Source Pane indicates the value of the program counter (PC) when the process encountered the error.
You can examine the state of all variables at the time the error occurred. See Examining and Editing Data and Program Elements.
If you start a process while you’re examining a core file, TotalView stops using the core file and switches to this new process.
Debugging a Core File | The File > Debug Core File dialog in the in-product Help |
The CLI dattach command’s -c core-files option | dattach in the Classic TotalView Reference Guide |


