Select Processes
After you select Memory Reports | Memory Comparisons, MemoryScape displays a screen that you use to select the processes and files that MemoryScape will compare.
Move your cursor over the graphic to obtain help.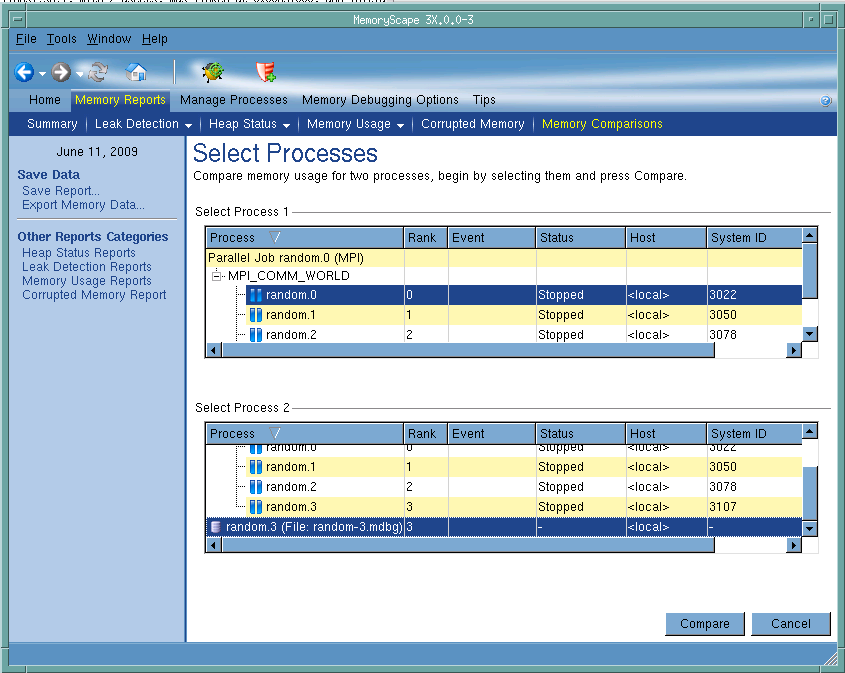
Select Processes 1
Select the first process to be used in the comparison. This file will be labeled Session 1 in the Memory Comparison Report that is displayed after you select the Compare button.
Select Processes 2
Select the second process to be used in the comparison. This file will be labeled Session 2 in the Memory Comparison Report that is displayed after you select the Compare button.
Compare
Click this button to tell MemoryScape to compare the two selected files. After you click this button, MemoryScape displays its Memory Comparison screen.
Debug in TotalView
Tells MemoryScape to open the currently selected process in TotalView. The TotalView process window will display the current state of that process. You must have a TotalView license available to debug in TotalView.
Be aware that opening the TotalView process window from within MemoryScape does not initialize TotalView in the same way as starting TotalView directly. The definitions in your .tvdrc file and your saved breakpoints are not loaded. However, you can load a breakpoint file using the Action Point menu item in the process window. If you need the definitions in your .tvdrc file, start TotalView first and open MemoryScape from within TotalView.
Red Zones
Tells MemoryScape to set the Red Zones option on or off for the selected processes.
This screen shows the third step of adding a program. If you are adding a different kind of file (for example, a memory debugging file), it may look different and have different (but similar) controls.


