Debug > Heap Baseline > Heap Change Summary
After selecting this command, the Memory Debugger displays its Heap Change Summary window. Before using this command, you must have enabled memory debugging for the process using the Debug > Enable Memory Debugging command or selecting Enable memory debugging in MemoryScape’s Memory Debugging Options page. In addition, you must have already set a baseline using either the Debug > Heap Baseline >Set Heap Baseline (in Process) or Debug > Heap Baseline> Set Heap Baseline (in Group) command.
Here is the window that the Memory Debugger displays:
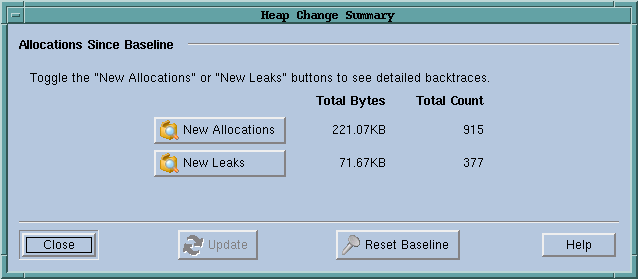 |
This example shows that 221.07 KB was allocated since a baseline was created and this memory was spread over 915 allocations. Also, 71.67 KB of memory was leaked. This memory was created by 377 allocations.
NOTE: A baseline does not show all allocations that have occurred. Instead, it only shows the allocations that still remain and any new leaks that have occurred.
Compare the data here with the data captured at a later time:
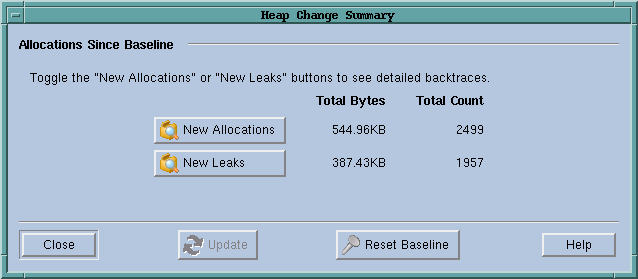 |
This window now shows that the program has allocated additional memory and, unfortunately, has continued to leak memory. The Memory Debugger can, of course, compare data to explicitly summarize this data.
The following figure shows how this window changes when you select the New Allocations button:
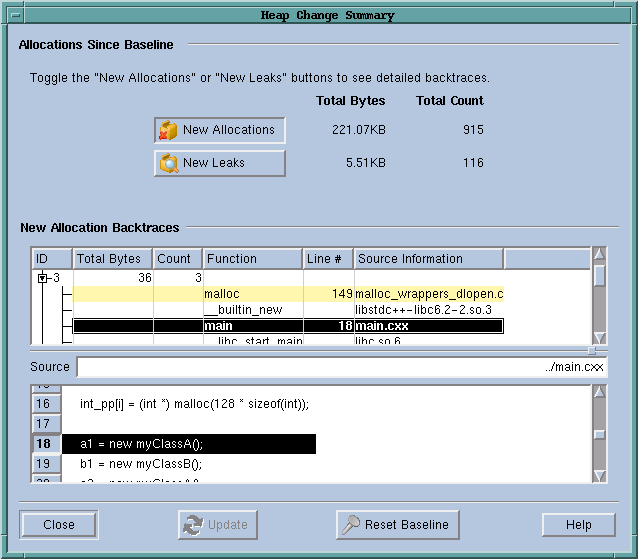 |
The display is similar if you select the New Leaks button. Each display shows a backtrace that shows where the memory was allocated. After you select a backtrace, the Memory Debugger shows the source code associated with the allocation.


