Process Event by Process
Use this screen to obtain more information on events. These events can occur because MemoryScape is notifying you either that a memory event occurred (see “Task 6: Using Run-time Events” for more information) or that your program raised an untrapped condition.
There are two ways to view process events: by process, as shown below, or by event. The By Event screen shows similar information with an event browser, useful if you are analyzing multiple processes stopped at different events.
Move your cursor over the graphic to obtain help.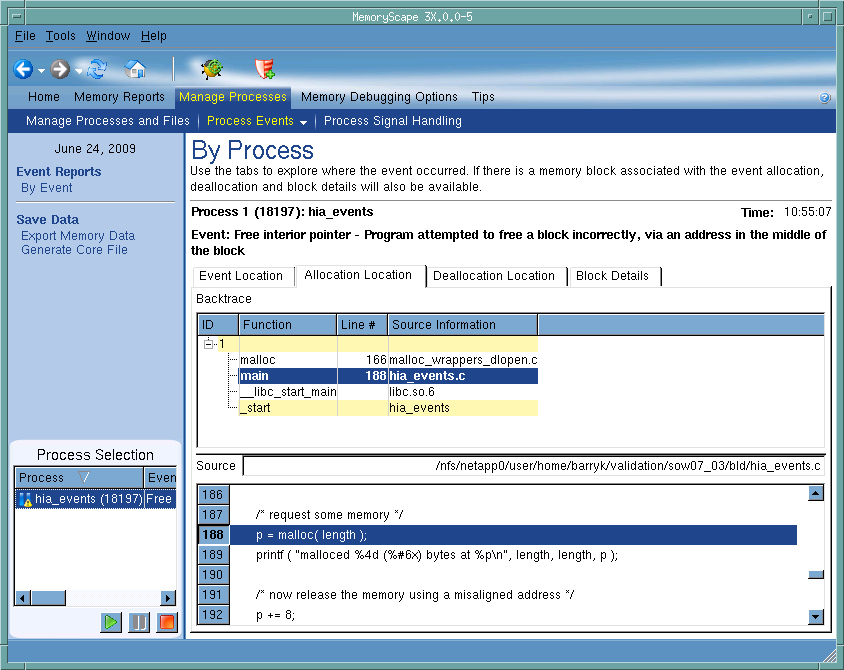
Processes with Events
MemoryScape remembers the events that occur within your program. Select the event you wish to obtain information about by clicking on it here.
Event description
Tells you about the event or the problem.
Event Location
Selecting this tab displays a page showing the backtrace, source file, and source code surrounding the place where the event occurred.
Allocation Location
Selecting this tab displays a page showing the backtrace, source file, and source code surrounding the place where your program allocated the memory block. Not all events have this information. For example, if your program tried to free stack memory, there would not be block allocation information.
Deallocation Location
Selecting this tab displays a page showing the backtrace, source file, and source code surrounding the place where your program deallocated the memory block. For example, Not all events have this information.
Block Details
Selecting this tab displays a page with a visual display of just this block as well as some additional information.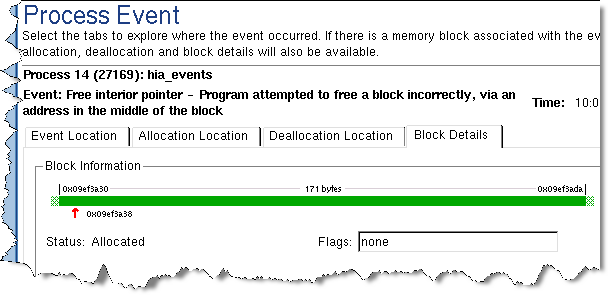
Backtrace
Contains the backtrace associated with the event, allocation, or deallocation. A backtrace is the call stack that existed when your program allocated the memory block.
Source file area
The source area shows the line in your program associated with the information shown in the backtrace area.
Source code area
Shows the line in your program associated with the information shown in the backtrace area. When you click on a function in the backtrace area, the information in this area changes.
Debug in TotalView
Tells MemoryScape to open the currently selected process in TotalView. The TotalView process window will display the current state of that process. You must have a TotalView license available to debug in TotalView.
Be aware that opening the TotalView process window from within MemoryScape does not initialize TotalView in the same way as starting TotalView directly. The definitions in your .tvdrc file and your saved breakpoints are not loaded. However, you can load a breakpoint file using the Action Point menu item in the process window. If you need the definitions in your .tvdrc file, start TotalView first and open MemoryScape from within TotalView.
Red Zones
Tells MemoryScape to set the Red Zones option on or off for the selected processes.


