Corrupted Memory Report
Use this screen to examine memory allocations that were corrupted because your program overwrote the guard blocks that MemoryScape placed around memory allocations. MemoryScape only adds guard blocks if you had previously set the level of debugging to either Medium or Extreme. Guard blocks, unlike some kinds of memory operations, do not need to be set before execution begins. Instead, you can halt your program, enable guard blocks by selecting Medium or Extreme in the basic Memory Debugging Options screen or by enabling them in the advanced screen, then resume execution.
For more information, see “Task 11: Viewing Corrupted Memory.”
Move your cursor over the graphic to obtain help.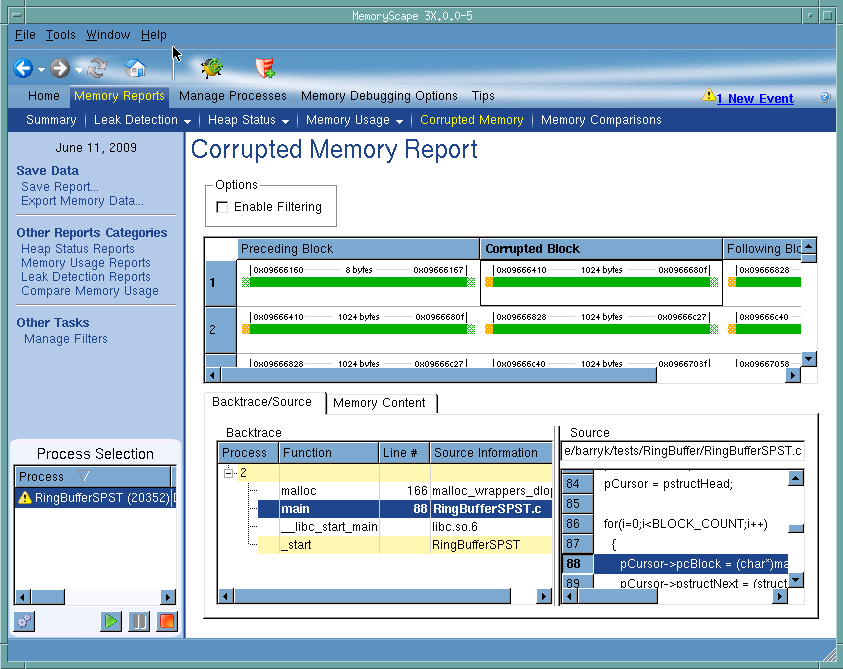
Options
If you have created a filter, selecting this button tells MemoryScape that it should only report on elements that the filter does not exclude.
Corrupted Block Table
Shows information on guard blocks that your program altered. This area is described beneath this figure.
Backtrace area
Contains the backtrace associated with the block that you select in the central corrupted block table. (A backtrace is the call stack that existed when your program allocated the memory block.) The Source area shows the line in your program associated with the selected function. Clicking on a function in this area changes what is displayed in the Source area.
Source area
Shows the line in your program associated with the information shown in the Backtrace area. When you click on a function in the Backtrace area, the information in this area changes.
Process Selection
Contains a list of processes and files added to this memory debugging session.
Memory Content
Selecting this tab displays the raw contents of memory. After you select a colored bar within the corrupted block area, MemoryScape displays memory contents.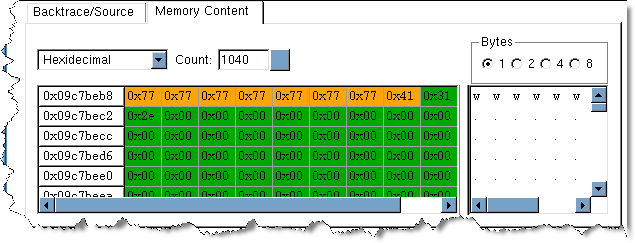
A link to an explanation of this tab’s contents is at the end of this topic.
Execution Controls
These controls let you refresh or create ( ) this report, run (
 ), or halt (
 ) your program.
), or halt () your program.The central area of this screen contains three columns of information. The center column contains the memory block that your program allocated and whose guard blocks your program altered. Notice the shaded area before and after the block within the column. These shaded areas represent the guard blocks. If the shading is in green, your program did not alter the guard block. However, If it is in orange, the program wrote data into it.this report, run
The left and right columns represent other allocations that your program made. These allocations immediately precede and follow the block whose guards were corrupted.
Because the blocks that precede and follow the corrupted block were also allocated on the heap, they too have guard blocks.
When you click on a block in any column or row, MemoryScape displays backtrace and source line information at the bottom of the screen.
For information on the Memory content tab, see “Task 11: Viewing Corrupted Memory.”
Debug in TotalView
Tells MemoryScape to open the currently selected process in TotalView. The TotalView process window will display the current state of that process. You must have a TotalView license available to debug in TotalView.
Be aware that opening the TotalView process window from within MemoryScape does not initialize TotalView in the same way as starting TotalView directly. The definitions in your .tvdrc file and your saved breakpoints are not loaded. However, you can load a breakpoint file using the Action Point menu item in the process window. If you need the definitions in your .tvdrc file, start TotalView first and open MemoryScape from within TotalView.
Red Zones
Tells MemoryScape to set the Red Zones option on or off for the selected processes.
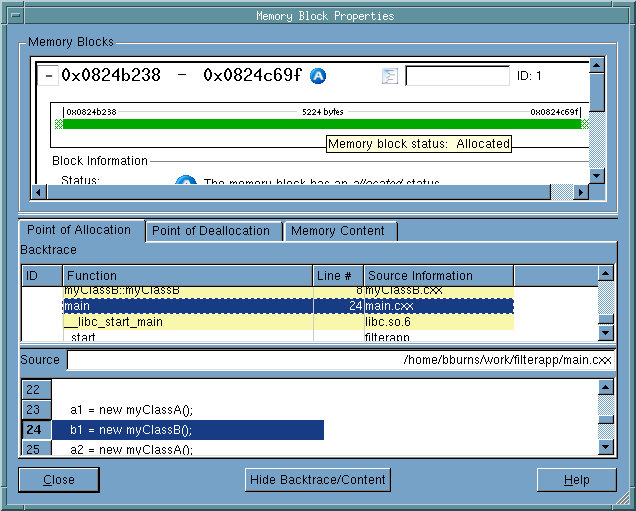
To obtain more information about any block, right click on it and select Properties from the pop-up menu. MemoryScape will then display considerably more information in its Block Properties window.