Add New Program
Use this screen to add a program to the current memory debugging session. After entering the name of the program, you can optionally enter command-line arguments and environment variables that your program needs. If you need to add more than one program, you must return to this screen for each.
After entering the filename, click Next.
Move your cursor over the graphic to obtain help.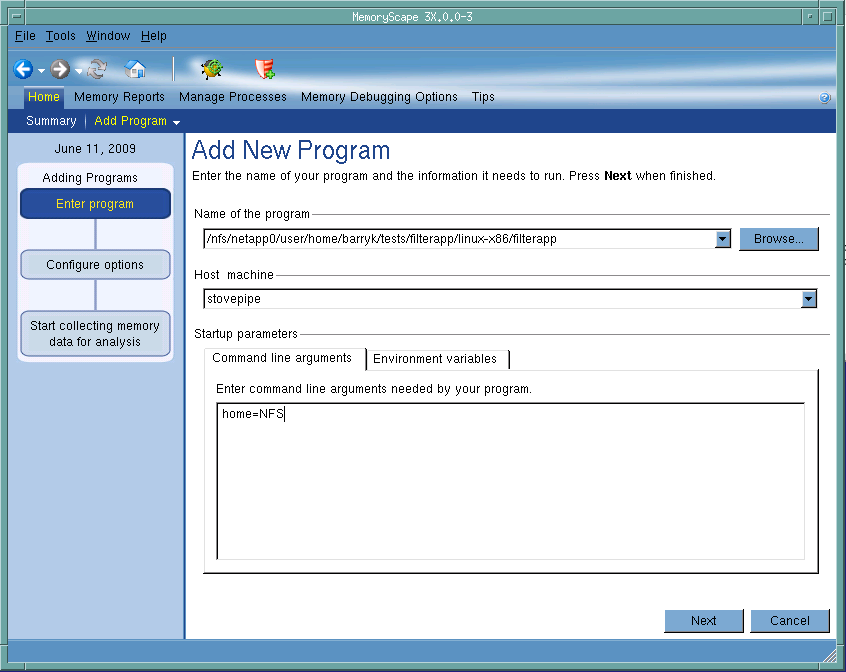
Name of the program
You can type the name of the file or look for it in the file system by clicking the Browse button. The path to this file can either be relative to the place in the file system from which you started MemoryScape or it can be an absolute file name. For example, you could either type my_progs/a_program or /home/me/my_progs/a_program.
Host machine
You can either type the name of the machine upon which your program will execute or select a previously named machine from the dropdown list. The machine entered within this area must have the same architecture as the machine upon which you are running MemoryScape, with the exception of those heterogeneous platforms described in Heterogeneous and Cross-Debugging on Linux, in the TotalView Platforms Guide. For example, if you are running MemoryScape on a linux-x86 machine, you cannot name a Sun Solaris system.
Specify command line arguments
Use this area to enter command-line arguments that your program will use when it begins executing. Type the arguments as one line within this control.
If you type arguments after your program has begun executing, these arguments are ignored until you restart it.
Specify environment variables
Use this area to create environment variables that will your program will use when it begins executing. You can also use this area to overwrite variables that are passed from your environment.
If you type arguments after your program has begun executing, these arguments are ignored until you restart it.
Adding Programs
This chart shows how many steps are involved in adding a file and where you are in this process.
Debug in TotalView
Tells MemoryScape to open the currently selected process in TotalView. The TotalView process window will display the current state of that process. You must have a TotalView license available to debug in TotalView.
Be aware that opening the TotalView process window from within MemoryScape does not initialize TotalView in the same way as starting TotalView directly. The definitions in your .tvdrc file and your saved breakpoints are not loaded. However, you can load a breakpoint file using the Action Point menu item in the process window. If you need the definitions in your .tvdrc file, start TotalView first and open MemoryScape from within TotalView.
Red Zones
Tells MemoryScape to set the Red Zones option on or off for the selected processes.


